

Latest OECD stats show US, China now spend more than $1 trillion each on R&D
24 Apr 2026


Author
Martin Croft
PR & Marketing Manager
Photo by Erol Ahmed on Unsplash
The Organisation for Economic Co-operation and Development (OECD) has just released its latest statistics covering national spend on Research & Development for 2024.
Growth in inflation-adjusted expenditure on Research and Experimental Development (GERD) in the OECD area, according to the latest estimates published in the OECD Main Science and Technology Indicators, remained at 2.6% in 2024, unchanged from 2023.
R&D expenditure rose in the United States by 3.4%, while growth in the European Union stood at 0.4%. Germany, the EU’s largest economy, recorded a 0.4% decline. In contrast, Japan, Korea and Türkiye reported growth rates of over 5%.
Growth in R&D investment was stable across the OECD in 2024, with tightening public budgets for R&D and a growing emphasis on defence.
The business sector continued to account for the largest share of OECD R&D expenditure with 73% of total GERD, up from 67% in 2010 (but unchanged since 2023).
While R&D expenditure in government organisations has recently grown by over 3%, this has not been sufficient to reverse its long-term decline in relative importance. Growth in higher education R&D stood at close to 2%.
The United States and the People’s Republic of China consolidated their position as the world’s largest economies in terms of R&D expenditure, widening the gap with others.
R&D spending comparisons that account for differences in purchasing power parity (PPP) indicate that China’s GERD caught up with and even surpassed the United States in 2024, at US$0.86 trillion in terms of PPP-adjusted dollars of 2020, the benchmark year for National Accounts. This implies that expressed in 2024 prices, both China and the United States reached the US$1 trillion mark.
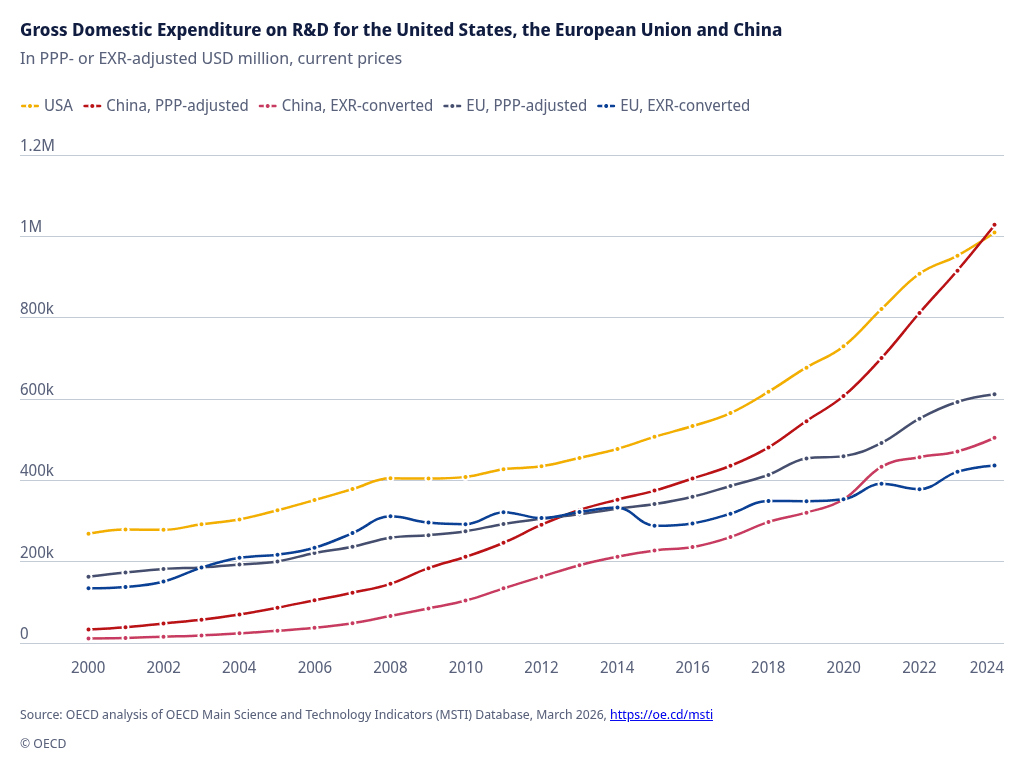
Source: OECD analysis of OECD Main Science and Technology Indicators (MSTI) Database, March 2026, https://oe.cd/msti


