

Ocean Tomo’s latest intangible asset market value report: intangibles now make up 92% of market value of US S&P500 index companies
12 Feb 2026

Author
Martin Croft
PR & Marketing Manager
Image: Ocean Tomo
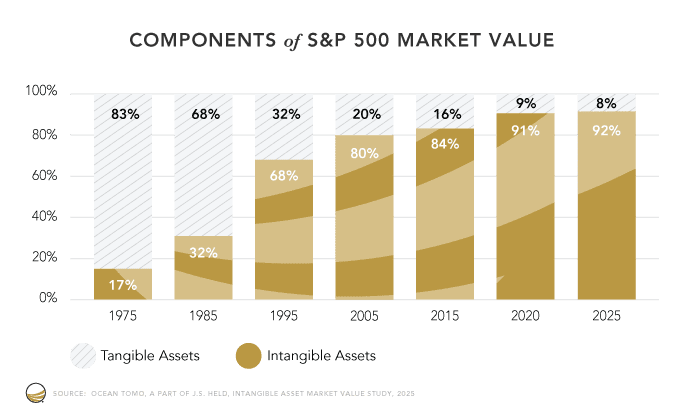
Ocean Tomo has just released its latest report on Intangible Asset Market Value (IAMV) covering companies in the Standard & Poor’s 500 (S&P500) stock market index (the 500 biggest companies in the US by asset value), which shows that by the end of 2025, the percentage of market value contributed by intangible assets had risen to 92%, compared with 17% in 1975, the first year the report series covers.
Ocean Tomo says:
“Intangible assets now constitute approximately 92% of S&P 500 market capitalization, while tangible assets have been reduced to a mere 8%. This 75-percentage point shift represents what Ocean Tomo has defined as ‘economic inversion’ – a wholesale transformation in the nature of value creation whereby economic worth has migrated from what can be ‘touched’ to what can be ‘thought’.”
The report’s authors compare this shift with the Industrial Revolution of the 18th and 19th centuries, adding that, in the same way that that shift “fundamentally restructured economic activity from agrarian and craft-based production to mechanized manufacturing, the intangible revolution has redefined the sources and measurement of corporate value in the 21st century.” However, they add, the Industrial Revolution took 100+ years to unfold, “the intangible revolution has occurred within a single human lifespan.”
Ocean Tomo points out that the report series now reflects a panel of 50 years of data in the US market and 20 years of data in selected other stock market indices. In addition to the S&P 500, since 2005, the report now also covers Europe (the S&P Europe 350 index), China (the Shenzhen CSI 300), South Korea (the KOSDAQ Composite indexes), and Japan (the Nikkei 255).
In Europe, the S&P Europe 350 index, which comprises 350 leading blue-chip companies from 16 developed European markets, saw intangible asset value increase by two percentage points to 77% since the last report five years ago.
In China and Korea, intangible asset value shares declined – in China, from 44% in 2020 to 25% in 2025, and, in Korea, from 61% to 50%. In both countries, Ocean Tomo says the fall is due to “regulatory, enforcement, and business model prohibitions,” which it will be researching further in a separate report.
By contrast, in Japan, the percentage of intangible assets jumped from 32% in 2020 to 53% at the end of 2025. In this case, Ocean Tomo suggests, regulatory changes may have had a positive impact – for example, the Japanese Stewardship Code (introduced in 2014 with the most recent revision being in 2025) requires investors and companies to either seek or provide clearer information on intangible asset valuations. Again, Ocean Tomo plans to investigate this in the future in the report that will look at China and Korea.


